Key Statistics
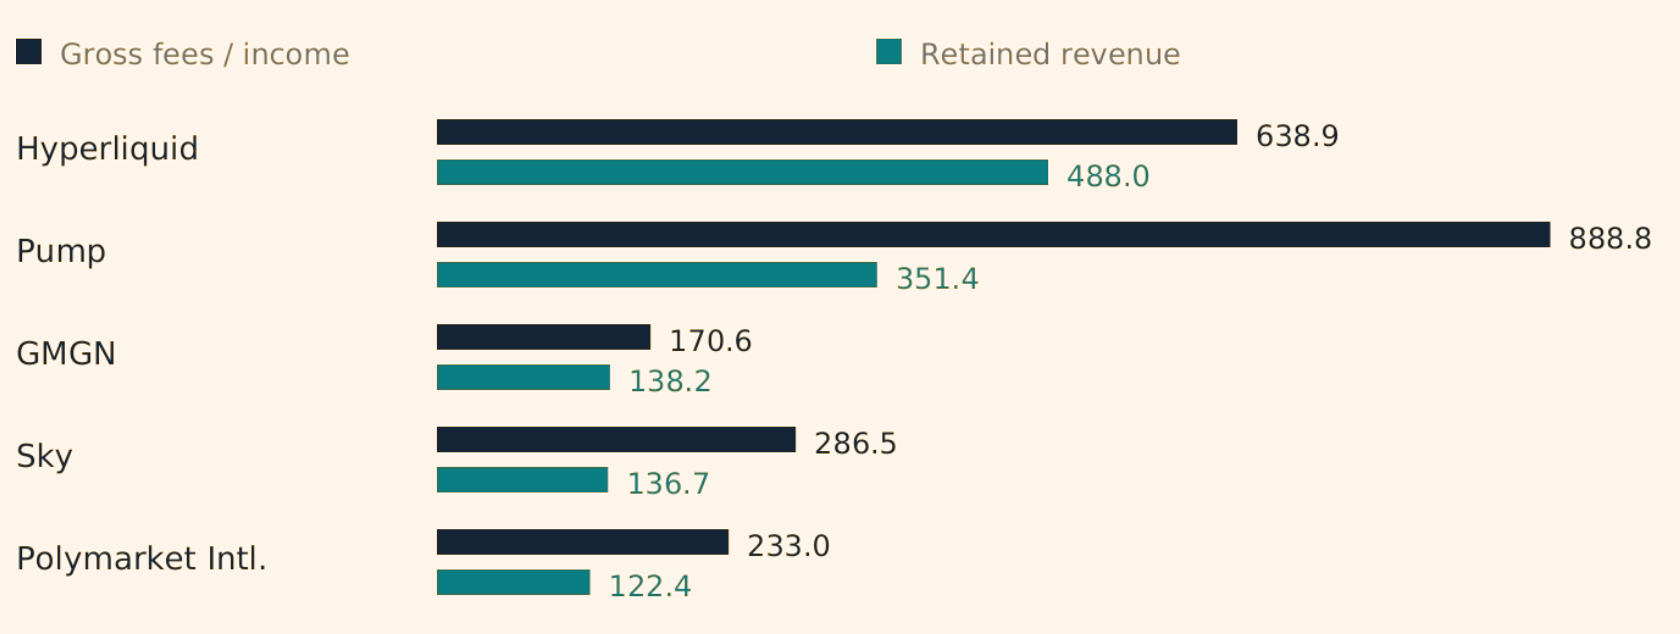
- Hyperliquid retained $488.0 million out of $638.9 million in gross fees and income during January–September 2026, on the report's provider-defined basis.
- Pump retained $351.4 million from $888.8 million of gross fees during the same nine months, a capture ratio of 39.5%.
- GMGN retained $138.2 million from $170.6 million in gross fees, after the report's identified and estimated referral deductions.
Figures and examples retain the report's original period, scope and source definitions. Consult the analysis and references below before making comparisons.
A trader can pay an application, a liquidity venue, and the network in a single transaction. Each may report revenue. Only some of that money remains after acquiring the customer and compensating capital providers, and only some of the remainder benefits a publicly traded token. Following those separate claims produces a more useful picture of onchain finance than another ranking of trading volume.
Three Findings That Matter Most
1. Customer access is an economic asset.
A trading interface can retain significant fees without supplying the underlying liquidity.
2. Buyback spending must be reconstructed independently of dashboard labels.
Blockworks records $240.5 million of PUMP purchases in the first nine months; the official dashboard reports $242.8 million, while a token-value proxy produces a different number.
3. Costs change the investment story.
Aave's own financial dashboard reports $17.8 million of Q3 revenue but just $2.4 million of net income under its accounting framework. [8–10, 25]
Bottom Line
The strongest businesses control scarce liquidity, distribution, or access to dollar funding. The investor's separate task is to identify the claim that actually receives their surplus.
Where the money goes
Provider-defined retained revenue, January-September 2026.
| Business / sector | 9M gross fees / income | 9M retained / capture | Q2 to Q3 retained | Economic beneficiary |
|---|---|---|---|---|
| 1. Hyperliquid [2] · Derivatives / markets | $638.9m | $488.0m · 76.4% | $148.6m to $174.0m | Assistance Fund / holders; product-specific allocations |
| 2. Pump [3] · Launch / trading apps | $888.8m | $351.4m · 39.5% | $91.6m to $137.7m | Operator / treasury; PUMP purchases |
| 3. GMGN [5] · Trading interface | $170.6m | $138.2m · 81.0% | $18.9m to $86.3m | Application operator |
| 4. Sky [6] · Dollar intermediation | $286.5m | $136.7m · 47.7% | $42.6m to $41.8m | Protocol reserves / governance-set holder allocations |
| 5. Polymarket Intl. [19] · Prediction markets | $233.0m | $122.4m · 52.5% | $57.6m to $56.6m | International operator |
View original exhibit
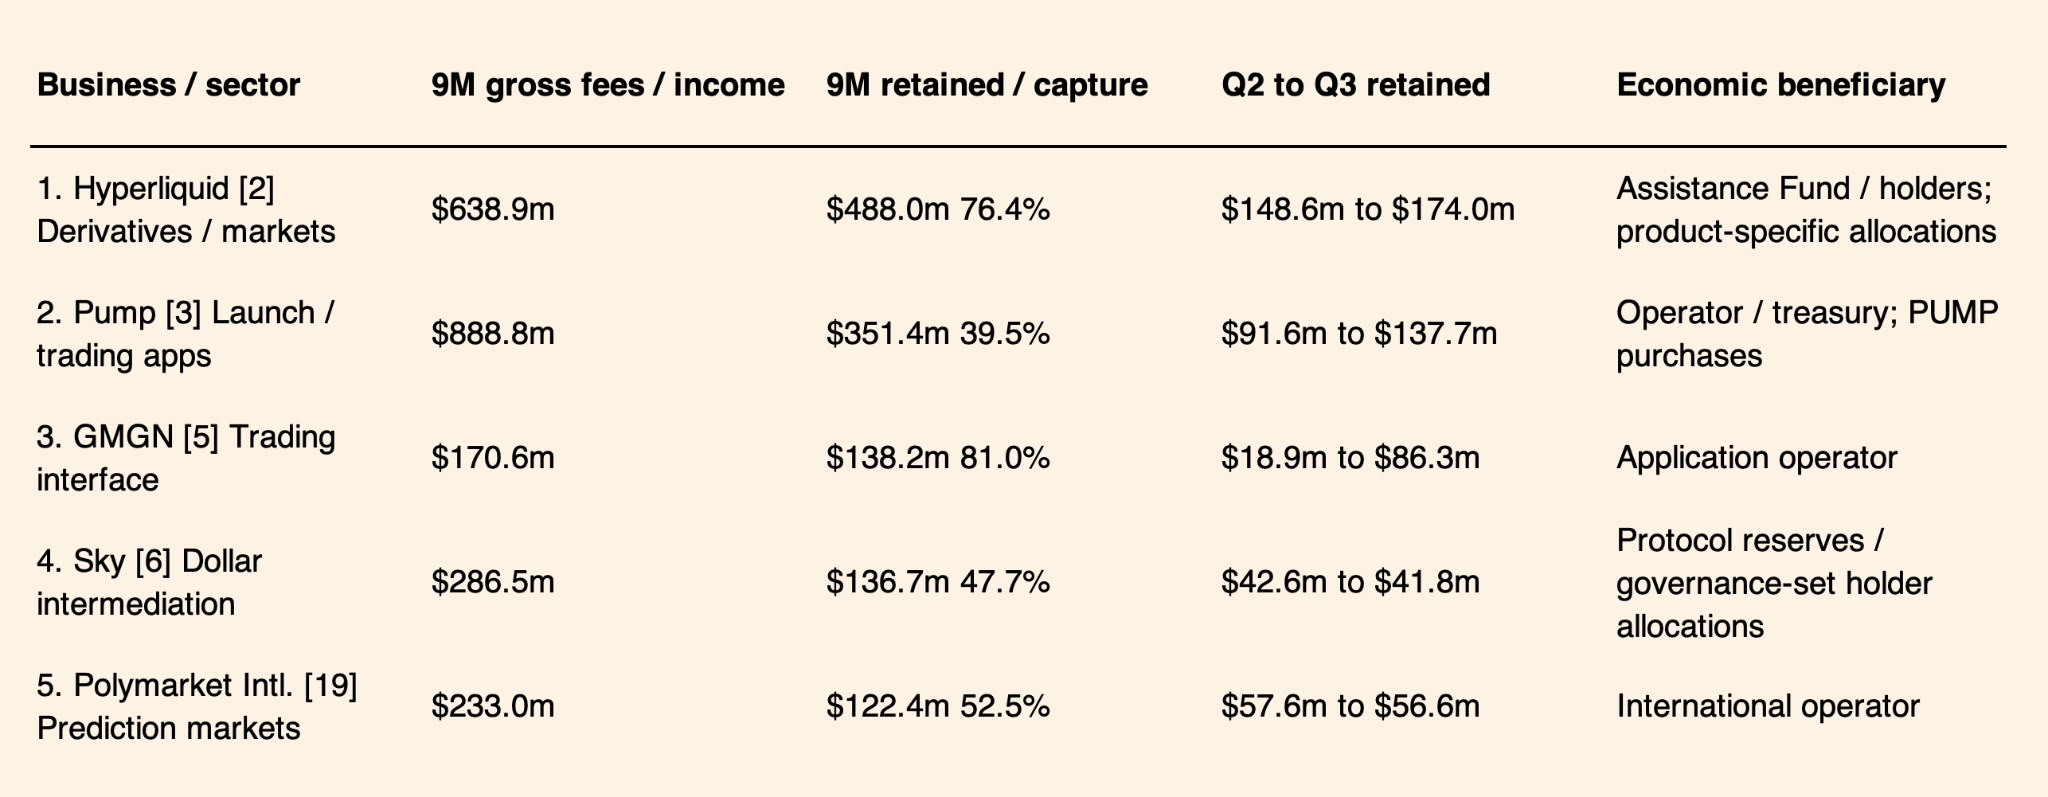
The ranking uses completed calendar quarters, ending September 30. Retained revenue means economics allocated to the protocol, its operator or its holders after identified supply-side payments. It precedes any unobserved payroll, grants, infrastructure costs and losses. A token purchase funded from this revenue is a use of funds, not additional revenue. [1]
The screen covers financial applications with onchain activity or fee collection. It excludes chains, centralized exchanges, centralized stablecoin reserve-income businesses, offchain fund managers and ETPs, and physical collectibles. Polymarket includes only its international onchain venue. Hybrid protocols can earn income from offchain assets. This is a provider-specific screen, not an audited industry census; measurement differences remain material. [1–6, 19]
The most important change within the year is GMGN's acceleration. Its Q3 retained revenue was more than four times Q2, while Sky and Polymarket were approximately flat. The same nine-month ranking therefore contains both rapidly expanding transactional businesses and comparatively steady financial intermediaries.
The fifth-place boundary is source-sensitive. Axiom records $106.7 million on the ranking basis, but $126.2 million in Blockworks' Solana net-revenue series, above Polymarket's figure here. The difference remains unreconciled. Axiom is therefore a material contender, and the five selected cases should not be interpreted as an incontestable global league table. [13]
1. HYPERLIQUID: Liquidity becomes paid access
Hyperliquid earns the first position by combining a trading venue with control over its surrounding infrastructure. The reconstructed dataset shows $638.9 million of fees and gross income, of which $488.0 million was allocated to protocol and holder economics. Q3 retained revenue reached $174.0 million, up 17.0% from Q2. These amounts establish scale; they do not establish a complete operating margin. [2]
Customers pay for immediate access to a liquid market, execution and increasingly specialized access to that market. The relevant moat is the combined order book, trader relationships and market structure. Replicating software is easier than persuading both sides of an active market to move simultaneously. Competition can still force lower fees, and new markets can deliver different economics from the original crypto contracts.
Hyperliquid's documentation makes that distinction concrete. HIP-3 growth mode reduces protocol fees and associated parameters by 90%, while deployers can retain a separate fee share. An expansion in trading volume therefore need not generate proportional revenue for the protocol. Builders and market deployers are businesses with their own claims on the transaction. [4]
Blockworks' July 29 research identifies a second commercial layer. Since their April launch, read and write priority mechanisms had generated $5.07 million; the latest 30 days contributed $2.75 million, or 6.7% of measured revenue. Traders were paying for earlier information and better execution priority. Those are observed figures at the report date, distinct from Blockworks' forecasts for later in the year. [7]
The historical parallel is an exchange becoming a seller of access as well as matching. In 2002, CME reported $453.2 million of net revenue, including $48.7 million of quotation-data fees. Trading volume rose 35% even as its average rate per trade fell from $0.71 to $0.64. Liquidity and distribution allowed lower unit pricing to coexist with commercial growth. Hyperliquid faces the same broad question: whether an expanding franchise can monetize enough new demand to offset fee compression. CME's corporate ownership and regulated clearing framework, however, are different from HYPE's token mechanics. [23]
The principal investment risk is a weakening of trading demand or liquidity quality. The principal analytical opportunity is to separate core trading, deployer economics and access fees, rather than extrapolate one headline take rate across the whole platform.
Fees vs Retained Revenue ($M)
2. PUMP: Distribution earns a toll
Pump's $888.8 million of gross fees translated into $351.4 million of retained revenue over nine months. The $537.4 million difference largely reflects payments to creators, liquidity providers and other participants across the included products. By Q3, fees had risen 80.1% from Q2, while retained revenue increased 50.4%. The capture ratio fell from 43.2% to 36.0%. More activity produced more income, but the ecosystem consumed a larger share of each fee dollar. [3]
This is a distribution business as much as a launch mechanism. Creating assets generates trading opportunities; the trading venue, creator incentives and acquired trading interface help keep customers inside the product family. The attraction for the operator is repeated fee-generating activity rather than the long-term success of every asset created. That also concentrates risk in speculative demand and the willingness of users to keep participating.
BankAmericard's 1958 launch offers a limited but useful comparison. Bank of America already reached roughly 45% of Fresno households and recruited merchants alongside them. Distribution helped turn a payment instrument into a useful network. Pump similarly needs coordinated participation, although its users can switch venues far more easily and its demand is much more speculative. The analogy concerns customer coordination, not equivalent social utility or risk. [24]
The source reconciliation improves confidence without erasing measurement differences. Blockworks' financial table reports $325.7 million of nine-month revenue, but leaves Terminal at zero. Its separately tracked Terminal series supplies another $21.9 million. Adding those products produces $347.6 million, within 1.1% of the $351.4 million DefiLlama reconstruction. A large apparent disagreement largely reflects consolidation. The remaining $3.8 million difference is unresolved, so the report retains one consistent ranking basis rather than averaging the providers. [3, 8, 13]
Pump therefore combines demonstrated revenue scale with a volatile demand base. Its substantial token purchases add a second economic question: how much revenue is spent supporting the token, under what rules, and with what consequences for supply?
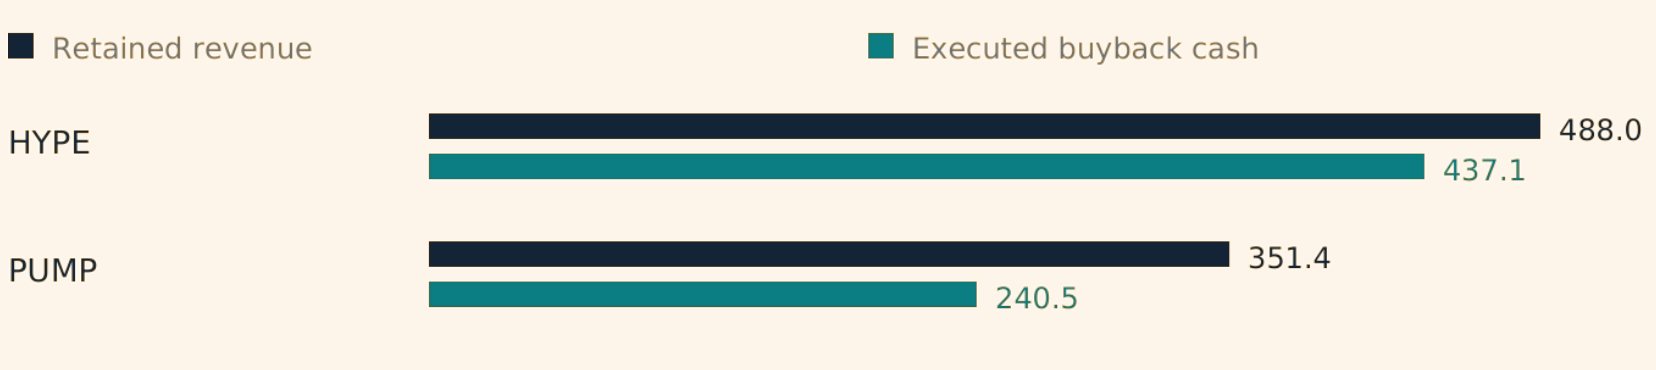
Cash spent and units retired can diverge
Hyperliquid spent 5.7% more on repurchases in Q3 than Q2, yet acquired 26.4% fewer HYPE: 2.04 million versus 2.77 million. A larger cash budget can retire fewer units when the average acquisition price rises. [14]
3. GMGN: The interface is a business
GMGN illustrates how valuable the customer-facing layer can become. Its official documentation charges a 1% handling fee, separate from network costs and other platform fees. Users pay for discovery, wallet analytics, execution tools and a convenient route into markets. The application can monetize trading without owning every pool or asset through which the trade passes. [12]
The dataset records $170.6 million of nine-month fees and $138.2 million retained after referral deductions. Q3 contributed $86.3 million, up 355.8% from Q2. This is strong evidence of commercial traction. It is also evidence of dependence on bursts of trading activity, rather than contracted recurring revenue. A high reported capture rate does not establish low operating costs or persistent customer loyalty. [5]
Referral economics are material. DefiLlama measures identified Solana referral payments but estimates EVM deductions at 16% of fees. EVM chains represent $137.1 million, or 80.4%, of the nine-month fee base. Increasing that assumed deduction to 18% would reduce retained revenue to approximately $135.4 million, below Sky. This is an illustrative sensitivity, not an assertion that the higher rate actually applied. The platform belongs among the leading businesses in this screen, but its precise position is less certain than a ranked table suggests. [5]
Blockworks records $14.04 million of Q3 Solana gross fees, within 0.55% of DefiLlama's $14.12 million. That corroborates the recent segment, not the entire multichain business. Earlier historical coverage differs and Blockworks' GMGN rebates are unpopulated. A DefiLlama figure and its underlying Dune query also remain one evidence pipeline. [5, 13]
GMGN also reveals a concentration hidden by company names. Its handling charge is separate from network and venue costs. One trader can generate fees for an interface and an underlying launch or trading venue. Those revenues can be legitimately separate while their demand exposures remain closely correlated. Five rows in a leaderboard do not automatically represent five independent economic engines. [12]
The operator is the observable beneficiary of retained application revenue. No native-token entitlement to that income was established in the reviewed documentation. Successful distribution should therefore be analyzed as a business before assuming it creates a public-token investment.
A small assumption can move a large ranking
An 18% EVM referral deduction, versus the adapter's 16% assumption, would put nine-month retained revenue at about $135.4 million, below Sky's $136.7 million. This sensitivity affects rank, not the evidence that GMGN collects substantial fees. [5]
4. SKY: The spread pays the bills
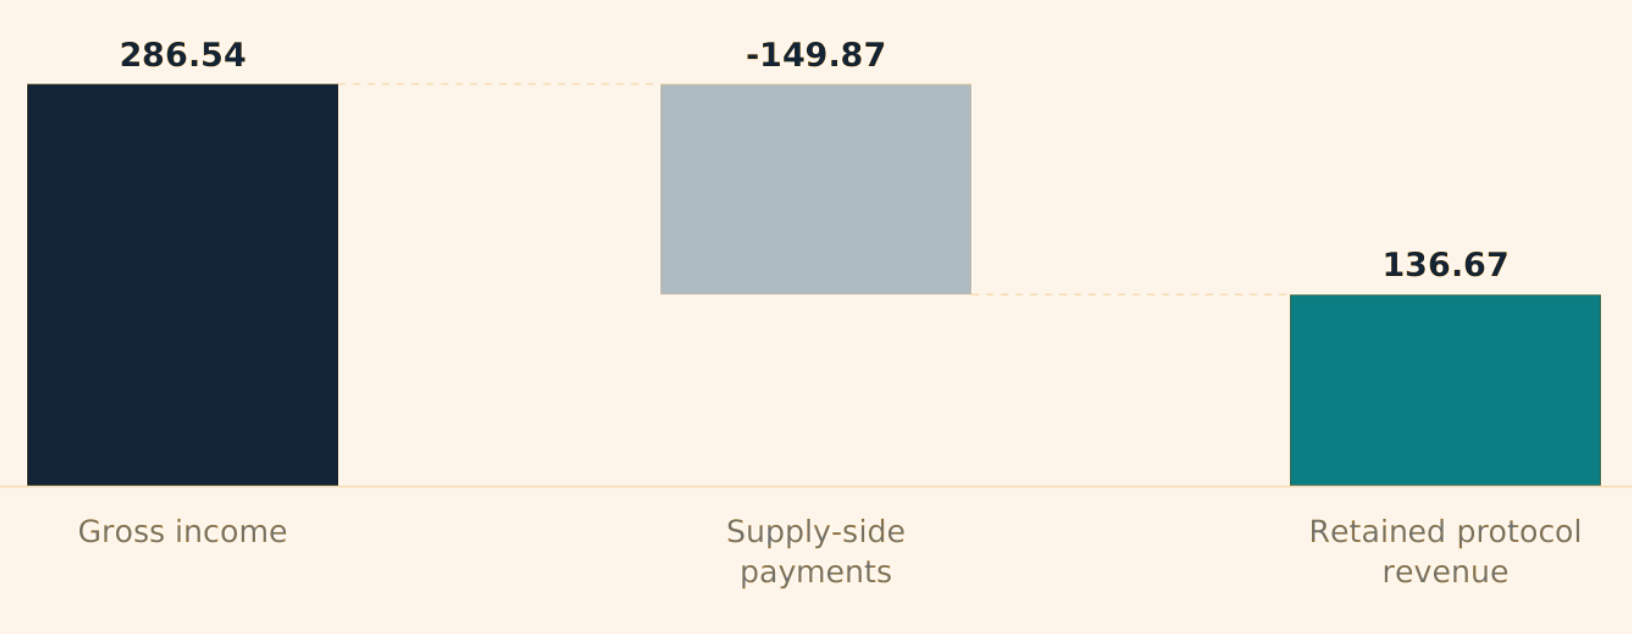
Sky's economics begin with the price of funding. Its nine-month gross income of $286.5 million left $136.7 million after $149.9 million of recorded supply-side payments. In Q3, retained revenue was $41.8 million, down 1.8% from Q2 even though gross income declined more sharply. The cost of attracting and retaining dollar balances matters as much as the size of those balances. [6]
The franchise combines collateral income, lending and a governed dollar ecosystem. Borrowers and underlying assets generate income; savers and other capital providers require compensation. Changing the savings rate can protect a spread, but it can also influence demand for the product. Distribution partnerships, credit exposures and collateral composition determine how stable that spread really is.
Schwab provides a historical example of the distinction between the service customers see and the economics financing it. In 2019, the company eliminated specified online trading commissions while net interest revenue supplied $6.516 billion, or 61% of its total revenue. Customer relationships supported monetization through financial intermediation. For Sky, the comparable mechanism is the spread between asset income and the cost of dollar funding. Schwab's regulated deposits and balance sheet are not equivalent to Sky's collateral and governance structure. [18]
Tokenholder allocation is a separate decision. Sky Frontier Foundation (SFF) reported approximately $3.41 million spent acquiring 51 million SKY in Q2. Its August update describes a change directing part of the funding cycle into USDS distributions to stakers. A revenue-generating system can retain capital, buy tokens or compensate committed holders. SFF is an independent foundation; its reports are stakeholder publications, not official protocol documentation. [16–17]
The SFF report uses a different financial presentation from the standardized series: Q2 net protocol surplus was $33.29 million, with $29.87 million remitted to reserves. These measures cannot simply replace ranking cells. The evidence supports meaningful spread income and capital retention, while future holder allocations remain sensitive to funding costs, credit outcomes and governance. [16]
SKY: January-September 2026. Gross income to retained protocol revenue.
5. POLYMARKET: Attention is not the fee base
Polymarket International generated $233.0 million of nine-month fees and retained $122.4 million after rebates, referrals and liquidity-related payments. Its Q3 fee base increased 10.4% from Q2, yet retained revenue declined 1.7%. Capture fell from 55.9% to 49.8%. The marginal dollar of activity was less valuable to the operator under the observed product mix and payout structure. [19]
That result is more informative than a record-volume headline. Prediction markets need enough opposing interest to make prices useful and positions tradeable. Paying market makers and encouraging activity can improve the product, but those payments are part of its economics. They cannot be excluded merely because the matching and settlement process is onchain.
Official fee documentation distinguishes markets by category and exempts geopolitical and world-event markets from trading fees. The markets generating public attention therefore need not be the markets generating revenue. The published referral program also distributes a portion of net fees to qualifying referrers. Monetization depends on category mix, fee rules and the cost of keeping liquidity competitive. [20]
The commercial advantage is the combination of brand recognition, existing liquidity and an interface that makes event trading accessible. The vulnerabilities are fee sensitivity, competing venues, market-resolution quality and regulatory constraints. The quantitative evidence supports substantial collections, but not an assumption that every new user or new market adds the same contribution.
Ownership is unusually clear in one respect: the official FAQ identifies pUSD as collateral backed by USDC and does not announce a native-token generation event. Collateral used to trade is not an ownership claim on the operator's revenue. The ranking therefore includes a successful onchain business without inventing a corresponding listed-token beneficiary. [22]
The scope distinction matters too. The combined provider page now includes the offchain US operation. Those fees are excluded here so that the onchain revenue numerator and fee denominator refer to the same business.
Watch contribution, not just volume
Q3 gross fees grew 10.4%, but retained revenue fell 1.7%. Capture declined from 55.9% to 49.8%. Market mix and participation payments determine whether activity growth reaches the operator. [19]
Scope: international onchain operation only. The US venue and separately flagged overlapping products are excluded from the ranking.
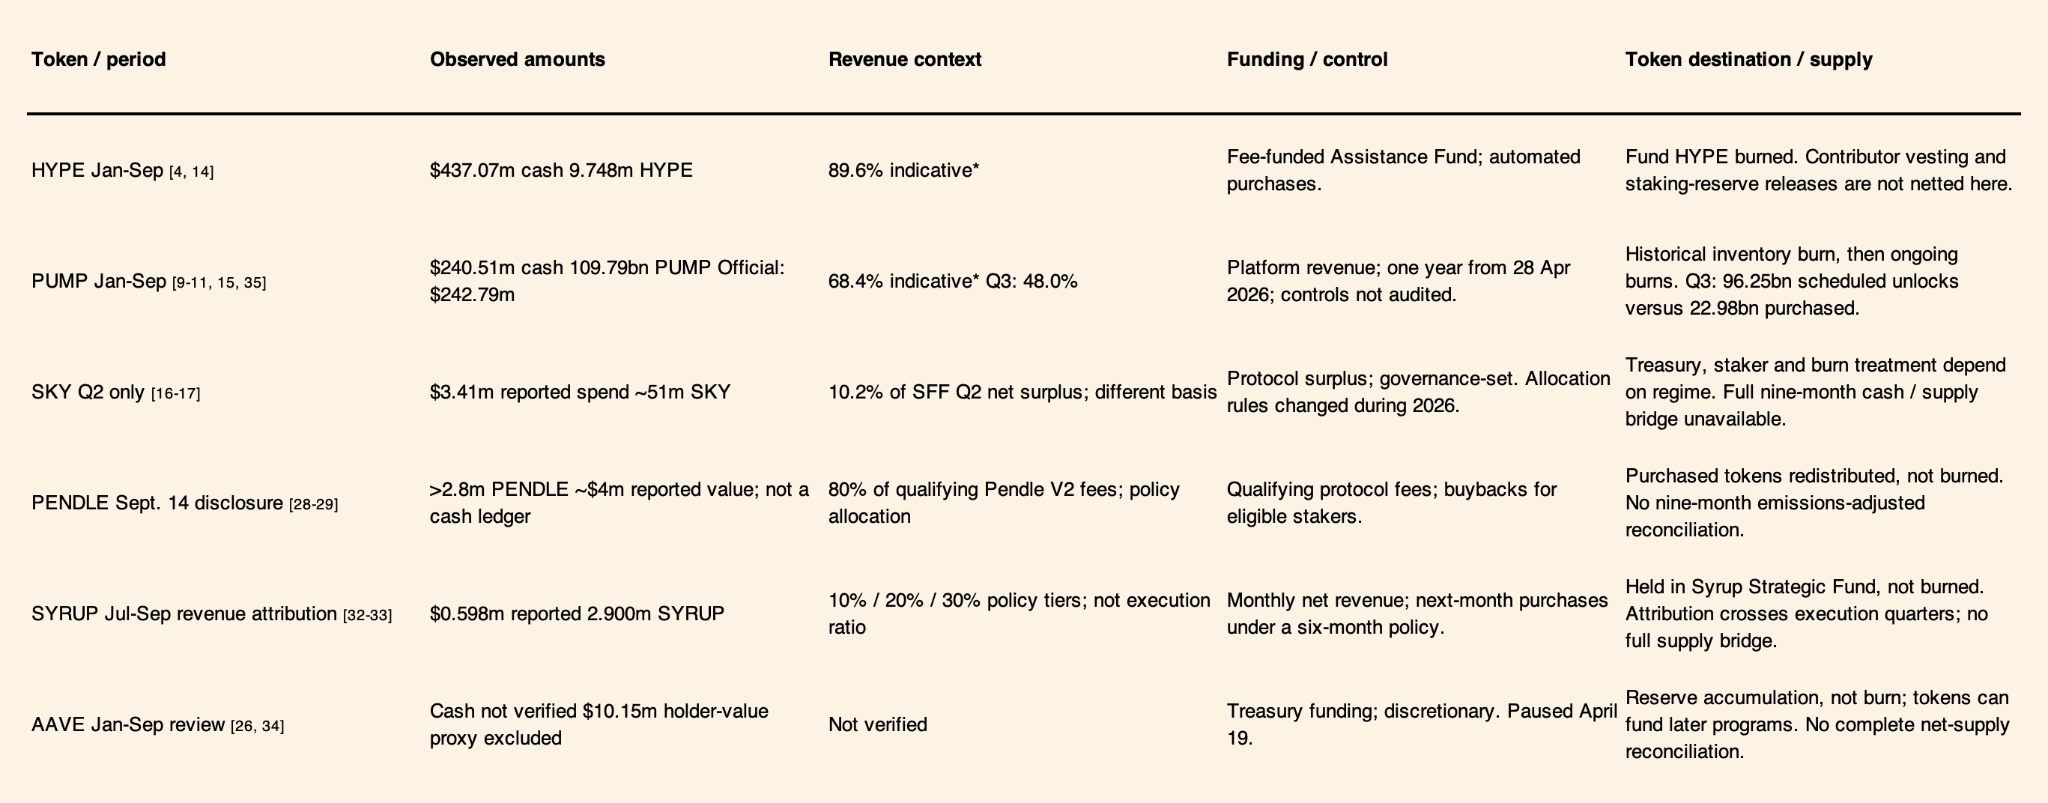
CAPITAL ALLOCATION: What buybacks actually deliver
Observed amounts and program mechanics, as of October 13.
| Token / period | Observed amounts | Revenue context | Funding / control | Token destination / supply |
|---|---|---|---|---|
| HYPE · Jan–Sep [4, 14] | $437.07m cash; 9.748m HYPE | 89.6% indicative* | Fee-funded Assistance Fund; automated purchases. | Fund HYPE burned. Contributor vesting and staking-reserve releases are not netted here. |
| PUMP · Jan–Sep [9–11, 15, 35] | $240.51m cash; 109.79bn PUMP. Official: $242.79m | 68.4% indicative*; Q3: 48.0% | Platform revenue; one year from 28 Apr 2026; controls not audited. | Historical inventory burn, then ongoing burns. Q3: 96.25bn scheduled unlocks versus 22.98bn purchased. |
| SKY · Q2 only [16–17] | $3.41m reported spend; ~51m SKY | 10.2% of SFF Q2 surplus; different basis | Protocol surplus; governance-set. Allocation rules changed during 2026. | Treasury, staker and burn treatment depend on regime. Full nine-month cash / supply bridge unavailable. |
| PENDLE · Sept. 14 disclosure [28–29] | >2.8m PENDLE; ~$4m reported value; not a cash ledger | 80% of qualifying Pendle V2 fees; policy allocation | Qualifying protocol fees; buybacks for eligible stakers. | Purchased tokens redistributed, not burned. No nine-month emissions-adjusted reconciliation. |
| SYRUP · Jul–Sep revenue attribution [32–33] | $0.598m reported; 2.900m SYRUP | 10% / 20% / 30% policy tiers; not execution ratio | Monthly net revenue; next-month purchases under a six-month policy. | Held in Syrup Strategic Fund, not burned. Attribution crosses execution quarters; no full supply bridge. |
| AAVE · Jan–Sep review [26, 34] | Cash not verified; $10.15m holder-value proxy excluded | Not verified | Treasury funding; discretionary. Paused April 19. | Reserve accumulation, not burn; tokens can fund later programs. No complete net-supply reconciliation. |
*Indicative cash-spending ratios use this report’s retained-revenue denominator. Coverage and timing differ; these are not contractual payout rates or a cash-balance reconciliation.
View original exhibit
BUYBACKS INTERPRETATION: What the token actually receives
The cleanest way to analyze a buyback is to follow four separate quantities: money spent, tokens acquired, tokens permanently removed and tokens subsequently entering circulation. A dollar-valued burn series answers a different question from an execution ledger. Price changes between purchase and destruction can create a large discrepancy without any new cash changing hands.
Hyperliquid provides the largest verified execution total: Blockworks records $437.1 million spent on 9.75 million HYPE during January-September. The protocol describes Assistance Fund HYPE as permanently burned. This cash series is separate from its $488.0 million standardized retained-revenue figure and from direct gas or auction burns. Accrual timing and product coverage prevent the difference from being interpreted as a cash balance. Contributor vesting and staking emissions must also be considered before claiming that purchases reduced net circulating supply. [2, 4, 14]
Pump is the clearest example in this investigation. Blockworks' dated execution series records $240.5 million spent and 109.8 billion PUMP acquired during January-September. The official dashboard reports $242.8 million spent, approximately 0.94% more. Its warning about custom-pair accounting prevents treating the agreement as a perfect reconciliation. Nevertheless, two separately published cash series support the scale of the purchases. The standardized holder-value series, $205.5 million, should not replace either cash ledger. [3, 9–10]
Dividing Blockworks cash spending by this report's revenue gives an indicative 68.4% nine-month purchase ratio and 48.0% for Q3. Coverage differs, so these are not contractual payout rates. Pump's dashboard states a 50% allocation for one year from April 28, 2026. Its legal disclosure calls the percentage approximate and denies rights to revenue, profits or distributions, with a carve-out for deterministically programmed execution. This is not a perpetual equity entitlement. [8–11]
The destination then determines the economic effect. Permanent destruction reduces outstanding token units. Treasury accumulation changes custody and may finance later grants or rewards. Distribution of purchased tokens gives recipients value but permits those tokens to return to the market. Each can be a legitimate policy; each has different implications for continuing holders.
Aave's April suspension illustrates the importance of discretion. A treasury can prioritize resilience over repurchases when conditions change. Sky's shifts between purchases and staker distributions similarly show that governance controls the form and timing of value transfer. Pendle's distribution model adds another distinction: buying tokens for committed stakers is not the same as burning them for all holders. [17, 26, 28]
Supply analysis must remain equally precise. New minting expands total supply; releases from existing reserves and vesting can increase available float without new minting. For PUMP, Blockworks' vesting assumptions imply 96.25 billion team and investor tokens scheduled to unlock in Q3, versus 22.98 billion tokens purchased. This is a schedule comparison, not verified selling or a complete circulating-supply bridge; other allocations also matter. It demonstrates why substantial burns can coexist with material additions to tradable inventory. [9, 15]
Pump's public program interface exposes an administrative buyback-configuration instruction. That alone does not establish the authority or restrictions of the currently deployed program, or disprove the stated one-year lock. This review checks published terms and purchase data; it is not a deployed contract-control audit. [10–11, 35]
BEYOND THE FIVE LEADERS: Three cases worth following
Smaller by retained revenue, with distinct products and financial evidence.
Pendle: monetizing demand for yield structure. Pendle's standardized nine-month retained revenue was $8.64 million, including $1.86 million in Q3, down 52.9% from Q2. Its product separates principal and yield exposure, enabling users to trade interest-rate and incentive expectations. That creates genuine financial utility, but demand can weaken when attractive yield opportunities disappear. The protocol's reported capture rate is high partly because the fee perimeter differs from a lending platform's gross borrower-interest measure; it is not evidence of a near-100% corporate margin. [27]
The current staking model directs 80% of qualifying Pendle V2 yield and swap fee revenue toward buybacks, with purchased PENDLE distributed to eligible participants. September communications reported more than 2.8 million tokens acquired, approximately $4 million in stated value. That is not a reconstructed nine-month cash or net-supply ledger. The policy should not be applied mechanically to all combined Pendle V2 and Boros revenue. It links qualifying income to committed holders. [27–29]
Maple: lending scale meets credit discipline. DefiLlama records $10.71 million of revenue from $82.66 million of fees over nine months; Q3 revenue rose 19.4% to $3.78 million. The provider counts specified protocol and pool-delegate fees, not solely the operator's income. Its 2026 records show no offchain OTC contribution. Maple's published Q2 revenue of $4.4 million differs from the provider's $3.16 million; the gap remains unreconciled. Underwriting and funding discipline determine whether lending scale creates durable value. [30–31]
Maple reports $597,982 spent buying 2.90 million SYRUP against July-September revenue. Purchases attributed to a month can execute in the next quarter. Acquired tokens enter the Syrup Strategic Fund rather than being burned. This is capital allocation under a defined policy, not a uniform dividend or a complete net-supply bridge. [32–33]
Aave: the value of an actual expense line. The standardized nine-month series records $58.93 million retained from $452.39 million of gross fees. Aave's own dashboard uses different revenue and expense definitions. Both sources include GHO-related activity; their revenue gap is unreconciled. The dashboard discloses service providers, incentives, staking and insurance costs. Those costs should not be combined with the other series' revenue. [25, 34]
For Q3, that dashboard reports $17.8 million of revenue, $15.4 million of expenses and $2.4 million of net income. The distinction transforms the analysis: lending can be a large, useful business while much of its retained revenue funds continued operations. Aave's brand, integrations and risk infrastructure are valuable, but those capabilities must be paid for. Its transparency provides a demanding benchmark for peers whose dashboards stop above the cost line.
An expense bridge changes the conclusion
Aave Q3: $17.80m revenue less $15.40m expenses leaves $2.40m of reported net income. This is the Aave Insights accounting presentation, separate from the provider screen, and is not established here as audited GAAP earnings. [25]
CONCLUSION
The evidence supports a hierarchy of business models, but not a mechanical token ranking. Hyperliquid has the strongest demonstrated revenue scale in the screened universe and a credible route into additional access-based monetization. Pump has built a large fee-generating distribution system and executed substantial token purchases. GMGN shows the earning power of the interface layer. Sky captures funding spreads. Polymarket monetizes selected event markets after paying for liquidity and participation.
Their different economics suggest five tests for investors. First, examine the source of demand. Trading venues and applications can grow together because they serve the same speculative customer. A portfolio containing several such tokens may diversify brand exposure while retaining a common activity risk. Lending and dollar intermediation introduce different drivers, although they bring credit and funding risks of their own.
Second, measure contribution alongside activity. Pump and Polymarket both grew Q3 gross fees faster than retained revenue. That does not automatically signal deteriorating franchises: payments to creators, makers or referrers may be productive acquisition spending. The question is whether those payments build durable participation or must be repeated indefinitely to preserve the same activity.
Third, distinguish commercial control from technical openness. An application does not need exclusive ownership of settlement infrastructure to earn a fee. Convenient execution, trusted distribution, liquidity and financial relationships can create customer willingness to pay. Conversely, an indispensable protocol may transfer most of the resulting income to the people supplying capital.
Fourth, demand the expense bridge. Aave's disclosed costs demonstrate how far a protocol-revenue leaderboard can sit from an earnings ranking. Missing expenses at another business do not imply superior profitability. A complete comparison requires incentives, service-provider costs, insurance and losses on compatible definitions, not merely an apparently attractive capture percentage.
Finally, establish the token's actual position in capital allocation. A programmed purchase, a governance-controlled treasury, a distribution to stakers and an enforceable residual claim are economically distinct. The quality of a business cannot compensate for purchasing the wrong claim on it.
HYPE and PUMP offer the clearest evidence here of large executed purchases combined with permanent token retirement, subject to supply offsets and policy control. Pendle offers a more targeted participation mechanism through distributions to eligible stakers. Among the smaller cases, watch Pendle's yield-market demand, Maple's underwriting and funding discipline, and Aave's ability to translate its disclosed revenue into earnings. Fee competition, yield conditions and liquidity migration could change this ordering.
Financial history offers the final connection. Exchanges, payment networks and brokerages became valuable by organizing relationships around markets. Onchain finance makes some of those collections easier to inspect and some allocations easier to automate. It does not remove the need to ask who supplies the capital, who pays the costs and who is entitled to the remainder.
METHODOLOGY: The limits of comparison
Observed data through September 30; sources accessed October 13, 2026.
Daily observations are summed over 273 UTC dates, January 1 through September 30. Q2 contains 91 days and Q3 92. No partial-October figure, forecast or annualized run rate enters the ranking. The retained measure is provider revenue after identified supply-side payments, including protocol and holder allocations. It is not net income.
Consolidation removes provider-flagged overlaps: HLP, Pump Mobile, Axiom Perps and Polymarket Combos. Polymarket US and offchain fund managers/ETPs are excluded. Sky and Maple can have underlying offchain exposures; Maple's provider series also counts pool-delegate fees. The scope concerns onchain financial applications, not exclusively onchain-origin income. [1–6, 19, 30]
Source independence is assessed at the calculation level: a dashboard and the Dune query feeding it are one pipeline. Provider agreement is corroboration, not an audit. Public Blockworks chart responses supplied dated records; no access to paid-only exports is claimed. Historical cash spending, token-value proxies, announced budgets and scheduled supply releases remain separate throughout.
Sources
[1] DefiLlama, revenue definitions and historical data, Jan–Sep 2026.
[2] DefiLlama, Hyperliquid trading revenue and perpetuals.
[3] DefiLlama, Pump revenue: bonding curve, PumpSwap, Terminal.
[4] Hyperliquid, fee routing, Assistance Fund and staking mechanics.
[5] DefiLlama, GMGN revenue and estimated referral expenses.
[6] DefiLlama, Sky protocol revenue and financial metrics.
[7] Blockworks, Hyperliquid priority fee economics, July 2026.
[8] Blockworks, Pump product financials and Terminal revenue.
[9] Blockworks, Pump executed buybacks, Jan–Sep 2026.
[10] Pump, official buyback dashboard and reported discrepancies.
[11] Pump, legal disclosure and token allocation, April 2026.
[12] GMGN, platform fees, gas charges and referral terms.
[13] Blockworks, Solana trading platforms: GMGN, Axiom, Terminal.
[14] Blockworks, Hyperliquid financial statements and cash flows.
[15] Pump, token vesting, unlocks and governance transparency.
[16] Sky Frontier Foundation, Q2 2026 quarterly report.
[17] Sky, tokenomics, surplus allocation and August 2026 update.
[18] Charles Schwab, 2019 Annual Report, pp. 25, 54.
[19] DefiLlama, Polymarket International retained revenue.
[20] Polymarket, trading fees, exemptions and referrals.
[21] Polymarket, maker rebate and liquidity incentive program.
[22] Polymarket, official token FAQ and collateral rights.
[23] CME Group, fiscal 2002 financial results.
[24] Visa, 2013 Annual Report, pp. 2, 13.
[25] TokenLogic, Aave DAO financial dashboard and Q3 earnings.
[26] Aave, April 2026 buyback suspension and token documentation.
[27] DefiLlama, Pendle retained protocol revenue.
[28] Pendle, fees, buybacks and sPENDLE staking mechanics.
[29] Pendle, Print 125, September 2026 product update.
[30] DefiLlama, Maple protocol and delegate revenue.
[31] Maple, Q2 2026 ecosystem update, July 2026.
[32] Maple, executed buybacks and token transparency.
[33] Maple, MIP-021 buyback governance framework.
[34] DefiLlama, Aave historical revenue and incentives.
[35] Pump, public program IDL and transparency disclosures.
Cover Artwork

Frederic Edwin Church, c. 1849
Risk Disclaimer
insights4vc provides independent research based primarily on publicly available information believed to be reliable at the time of publication. Figures may change because of market prices, token supply, reclassification and methodology updates. Legal structures, investor rights and regulatory treatment vary by product and jurisdiction.
This article does not constitute investment, legal, tax, accounting or financial advice, or an offer, solicitation or recommendation regarding any security, token, fund interest or other asset. insights4vc makes no representation regarding the completeness or accuracy of third-party data. Readers should conduct independent due diligence and consult appropriately qualified advisers before making investment or business decisions.
Published by the insights4vc research team. See our research methodology, source standards and corrections policy. Dates and measurement periods are stated in each analysis.
Read next